NCERT Solutions Class 10 Maths Chapter 14 Statistics – Here are all the NCERT solutions for Class 10 Maths Chapter 14. This solution contains questions, answers, images, explanations of the complete Chapter 14 titled Statistics of Maths taught in Class 10. If you are a student of Class 10 who is using NCERT Textbook to study Maths, then you must come across Chapter 14 Statistics. After you have studied lesson, you must be looking for answers of its questions. Here you can get complete NCERT Solutions for Class 10 Maths Chapter 14 Statistics in one place.
NCERT Solutions Class 10 Maths Chapter 14 Statistics
Here on AglaSem Schools, you can access to NCERT Book Solutions in free pdf for Maths for Class 10 so that you can refer them as and when required. The NCERT Solutions to the questions after every unit of NCERT textbooks aimed at helping students solving difficult questions.
For a better understanding of this chapter, you should also see summary of Chapter 14 Statistics , Maths, Class 10.
| Class | 10 |
| Subject | Maths |
| Book | Mathematics |
| Chapter Number | 14 |
| Chapter Name |
Statistics |
NCERT Solutions Class 10 Maths chapter 14 Statistics
Class 10, Maths chapter 14, Statistics solutions are given below in PDF format. You can view them online or download PDF file for future use.
Statistics Download

Did you find NCERT Solutions Class 10 Maths chapter 14 Statistics helpful? If yes, please comment below. Also please like, and share it with your friends!
NCERT Solutions Class 10 Maths chapter 14 Statistics- Video
You can also watch the video solutions of NCERT Class10 Maths chapter 14 Statistics here.
If you liked the video, please subscribe to our YouTube channel so that you can get more such interesting and useful study resources.
Download NCERT Solutions Class 10 Maths chapter 14 Statistics In PDF Format
You can also download here the NCERT Solutions Class 10 Maths chapter 14 Statistics in PDF format.
Click Here to download NCERT Solutions for Class 10 Maths chapter 14 Statistics
Question & Answer
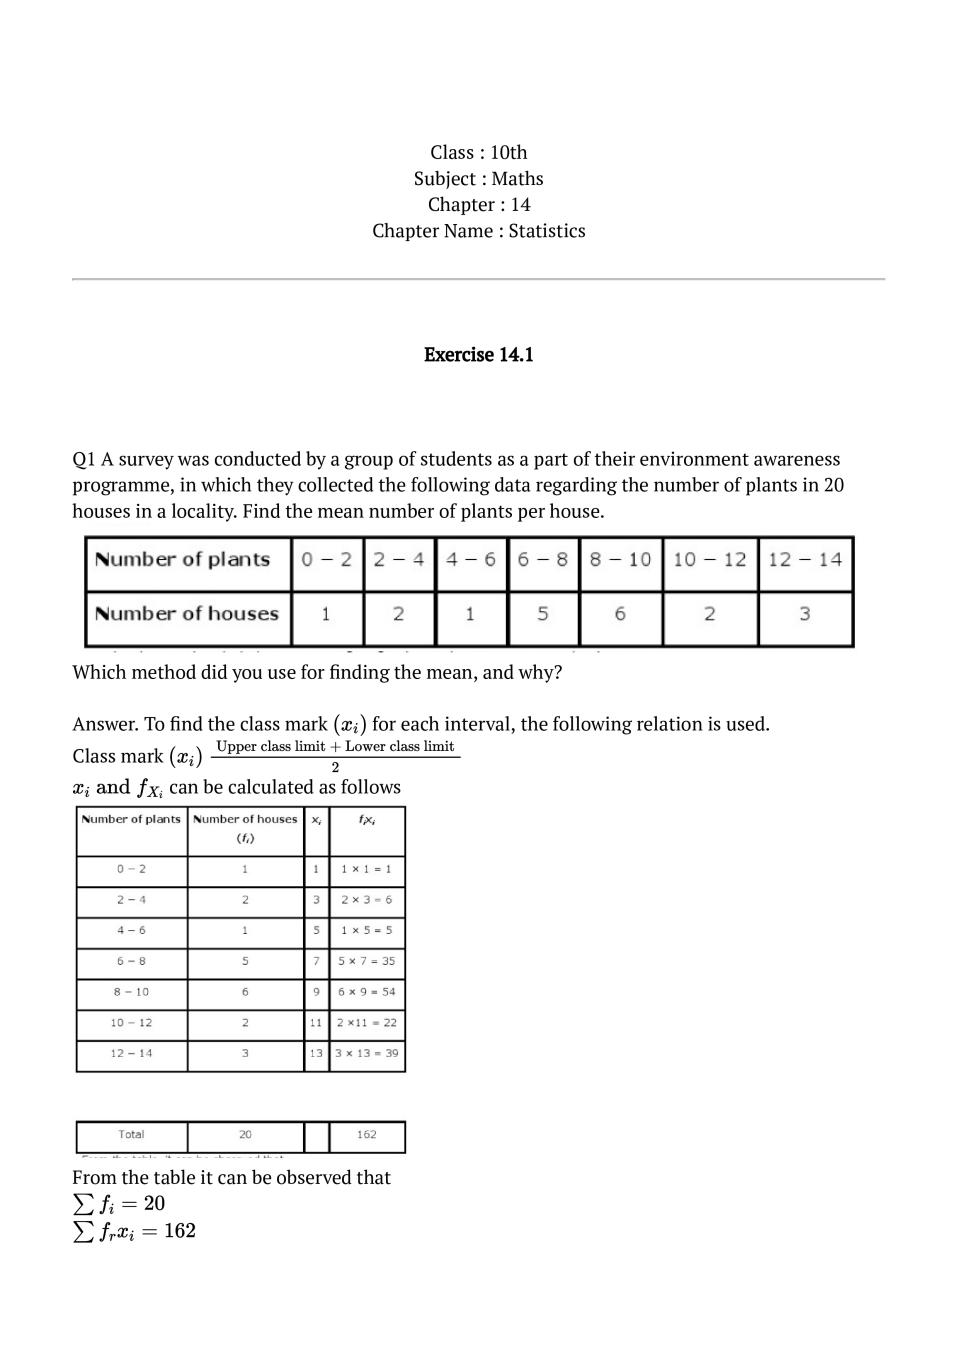
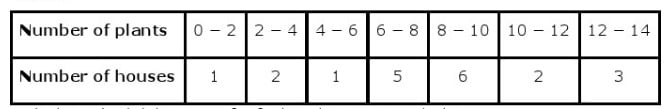
Q.1: A survey was conducted by a group of students as a part of their environment awareness programme, in which they collected the following data regarding the number of plants in 20 houses in a locality. Find the mean number of plants per house.

Which method did you use for finding the mean, and why?
Ans : To find the class mark \( \left(x_{i}\right) \) for each interval, the following relation is used. Class mark \( \left(x_{i}\right) \) \( \frac{\text { Upper class limit + Lower class limit }}{2} \) \( x_{i} \text { and } f_{X_{i}} \) can be calculated as followsFrom the table it can be observed that \( \sum f_{i}=20 \) \( \sum f_{r} x_{i}=162 \) Mean \( \overline{x}=\frac{\sum f_{f_{i}}}{\sum f_{i}} \) \( =\frac{162}{20}=8.1 \) Therefore mean number of plants per house is 8.1 Here, direct method has been used as the values of class marks \( \left(x_{i}\right) \) and \( f_{i} \) are small
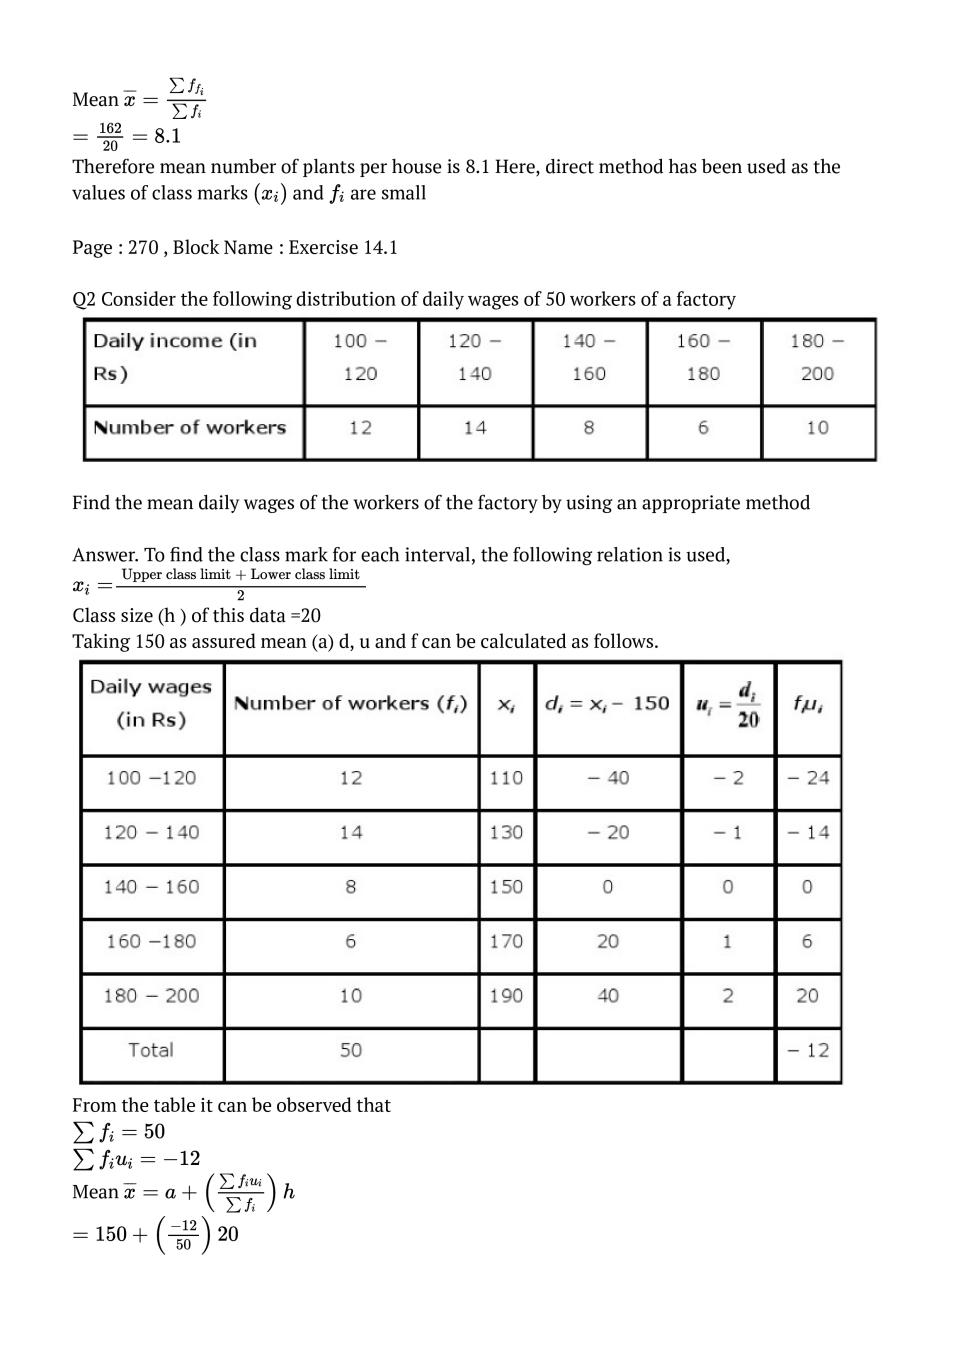
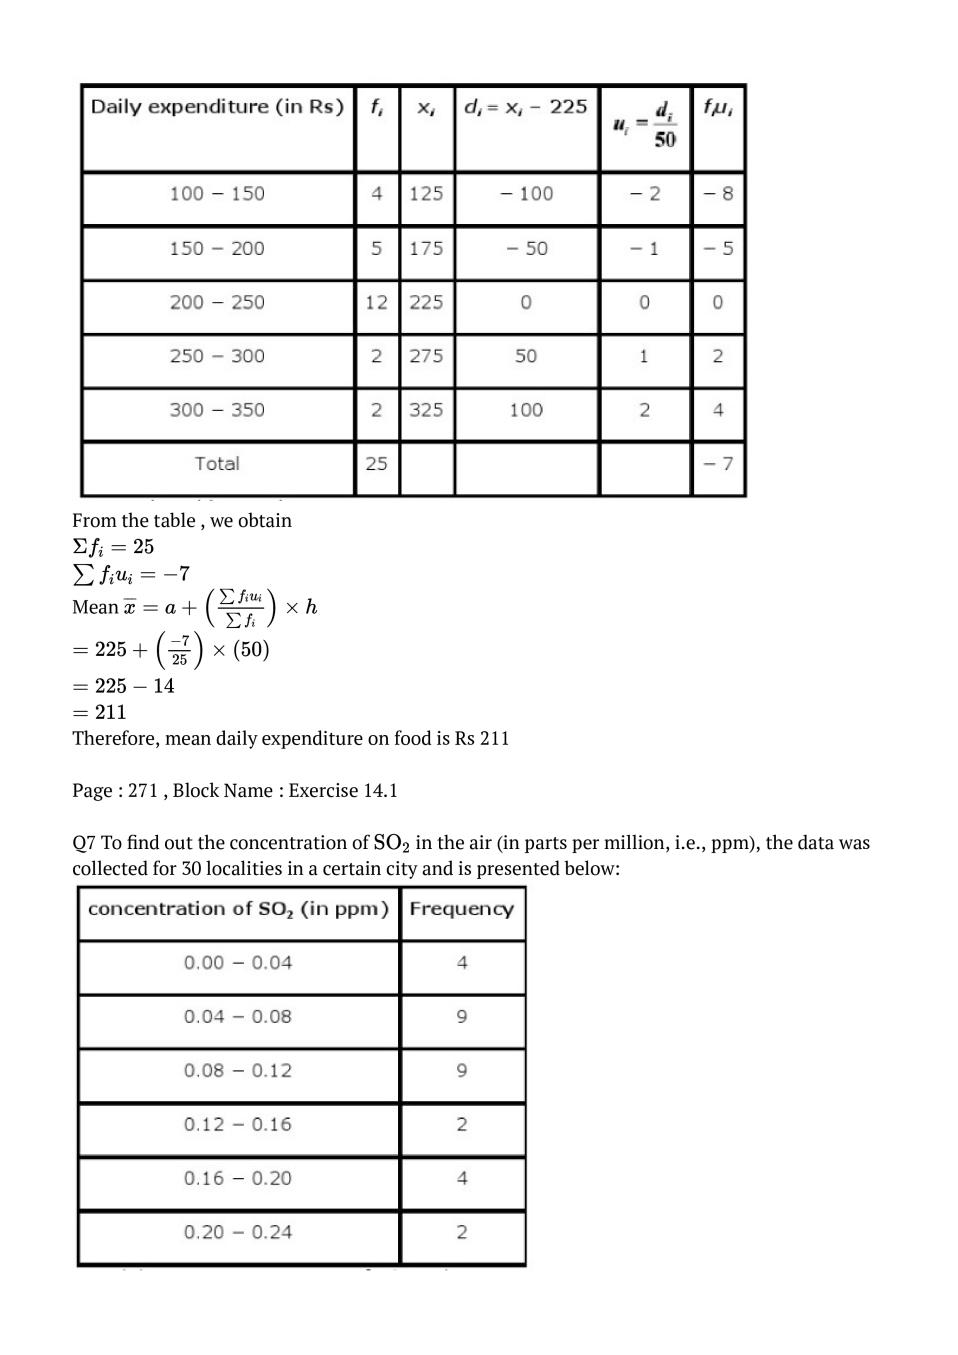
Q.2: Consider the following distribution of daily wages of 50 workers of a factory
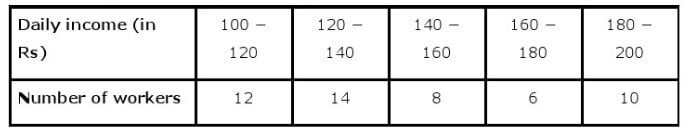 Find the mean daily wages of the workers of the factory by using an appropriate method
Ans : To find the class mark for each interval, the following relation is used, \( x_{i}=\frac{\text { Upper class limit }+\text { Lower class limit }}{2} \) Class size (h ) of this data =20 Taking 150 as assured mean (a) d, u and f can be calculated as follows.From the table it can be observed that \( \sum f_{i}=50 \) \( \sum f_{i} u_{i}=-12 \) Mean \( \overline{x}=a+\left(\frac{\sum f_{i} u_{i}}{\sum f_{i}}\right) h \) \( =150+\left(\frac{-12}{50}\right) 20 \) \( =150-\frac{24}{5} \) \(=150-4.8 \) \( =145.2 \) Therefore the mean daily wage of the workers of the factory is Rs 145.20
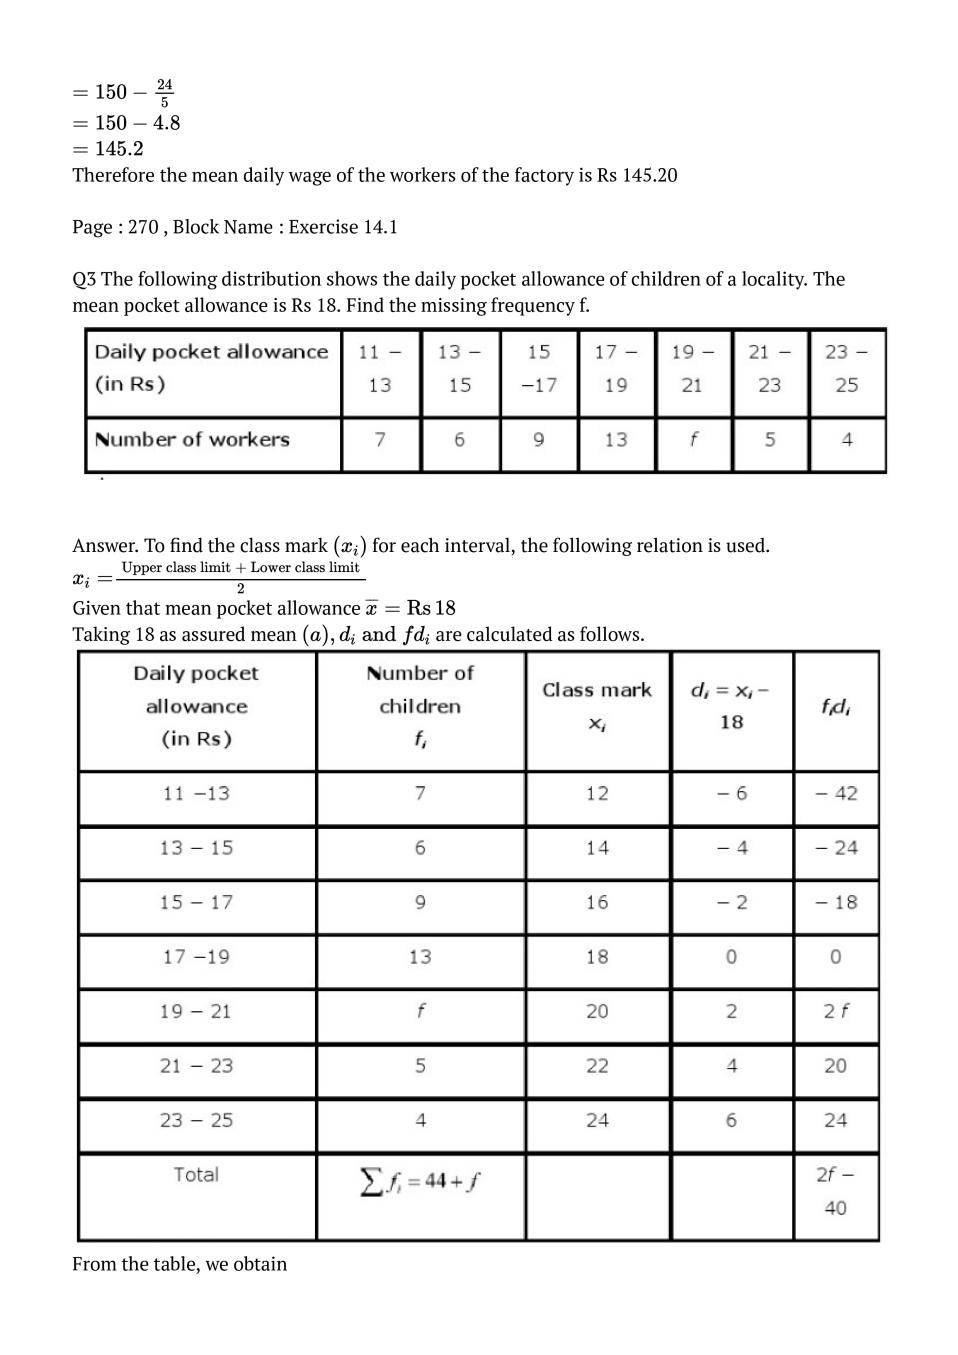
Q.3: The following distribution shows the daily pocket allowance of children of a locality. The mean pocket allowance is Rs 18. Find the missing frequency f.
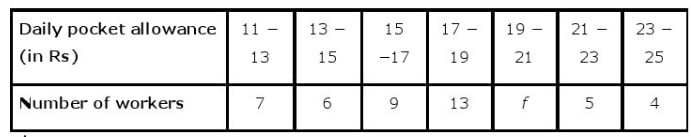
Ans : To find the class mark \(\left(x_{i}\right) \) for each interval, the following relation is used. \( x_{i}=\frac{\text { Upper class limit }+\text { Lower class limit }}{2} \) Given that mean pocket allowance \( \overline{x}=\operatorname{Rs} 18 \) Taking 18 as assured mean \( (a), d_{i} \text { and } f d_{i} \) are calculated as follows.From the table, we obtain \( \sum f_{i}=44+f \) \( \sum f_{i} u_{l}=2 f-40 \) \(\overline{x}=a+\frac{\sum f_{i} d_{i}}{\sum f_{l}} \) \( 18=18+\left(\frac{2 f-40}{44+f}\right) \) \( 0=\left(\frac{2 f-40}{44+f}\right) \) \( 2 f-40=0 \) \( 2 f=40 \) \( f=20 \) Hence the missing frequency f is 20
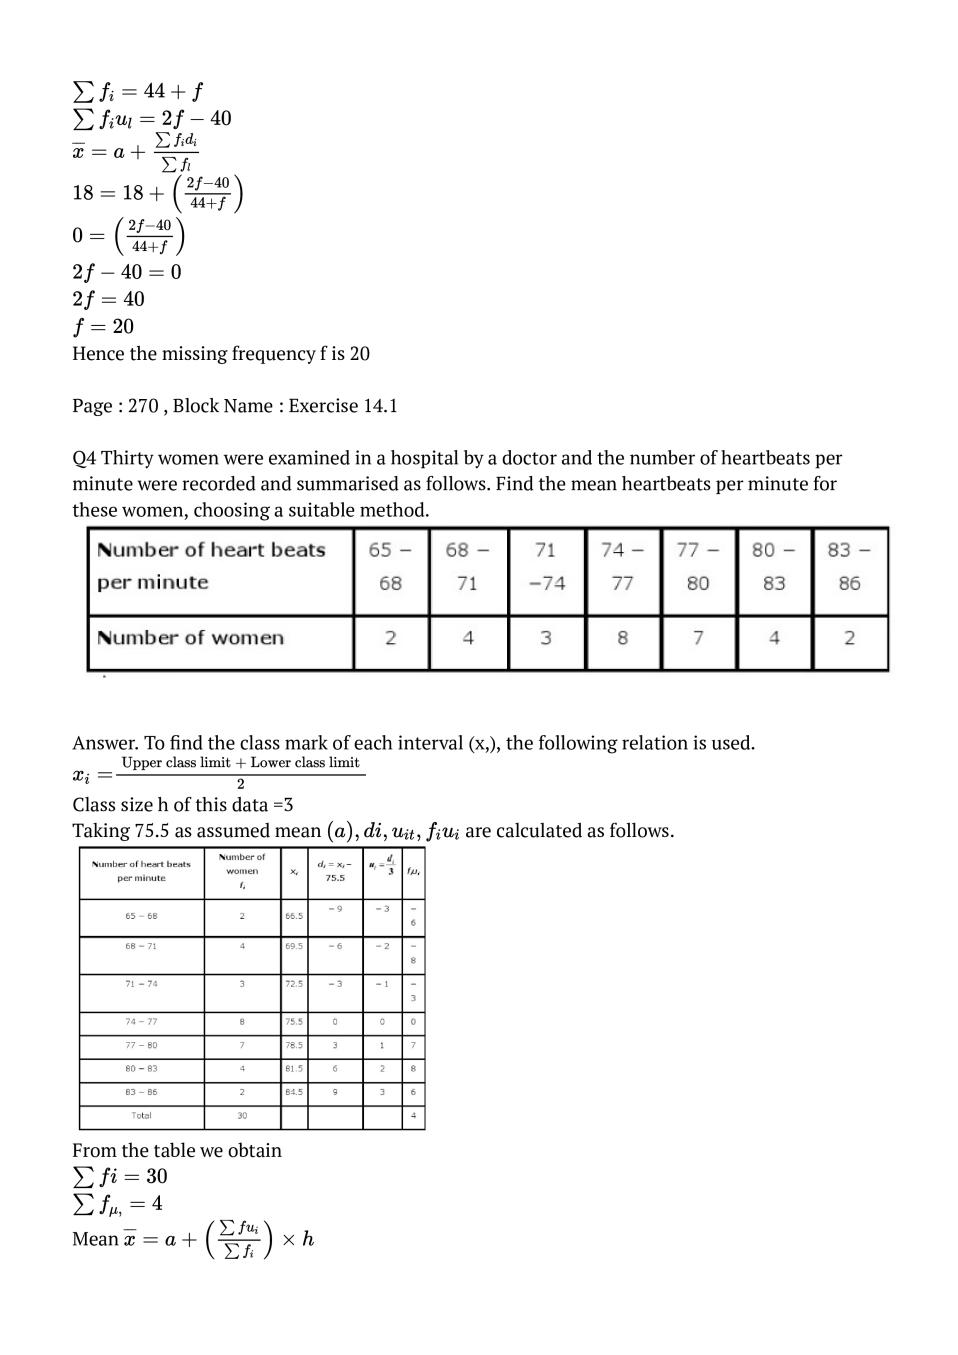
Q.4: Thirty women were examined in a hospital by a doctor and the number of heartbeats per minute were recorded and summarised as follows. Find the mean heartbeats per minute for these women, choosing a suitable method.
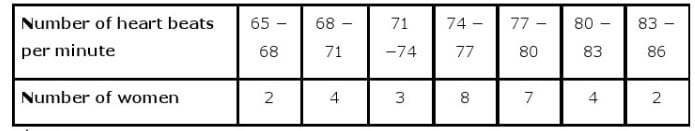
Ans : To find the class mark of each interval (x,), the following relation is used. \( x_{i}=\frac{\text { Upper class limit }+\text { Lower class limit }}{2} \) Class size h of this data =3 Taking 75.5 as assumed mean \( (a), d i, u_{i t}, f_{i} u_{i} \) are calculated as follows.From the table we obtain \( \sum f i=30 \) \(\sum f_{\mu,}=4 \) Mean \( \overline{x}=a+\left(\frac{\sum f u_{i}}{\sum f_{i}}\right) \times h \) \(=75.5+\left(\frac{4}{30}\right) \times 3 \) \( =75.5+0.4=75.9 \) Therefore ,mean hear beats per minute for these women are 75.9 beats per minute.
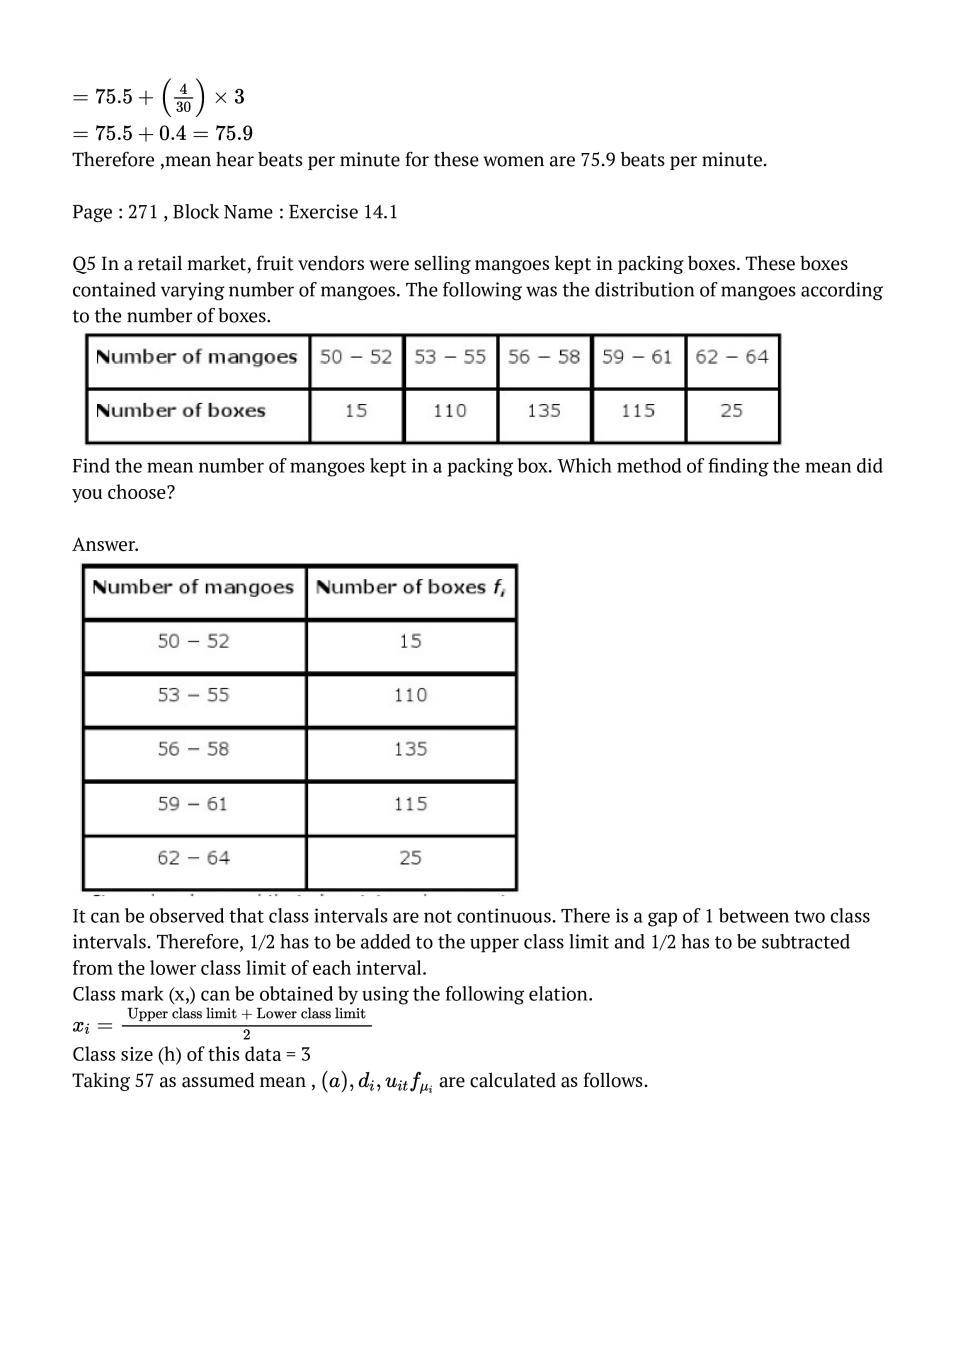
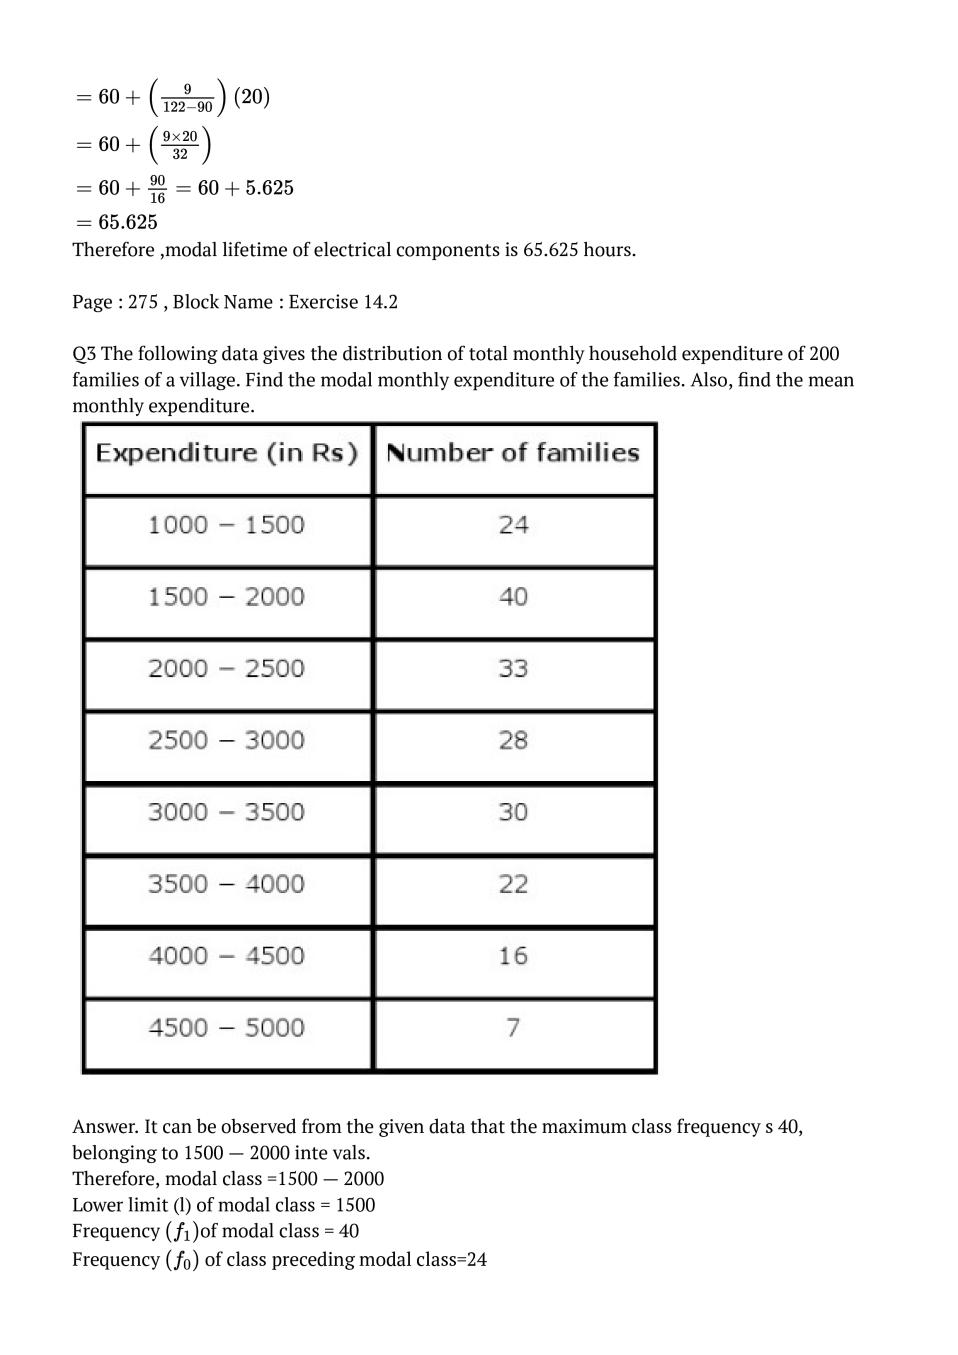
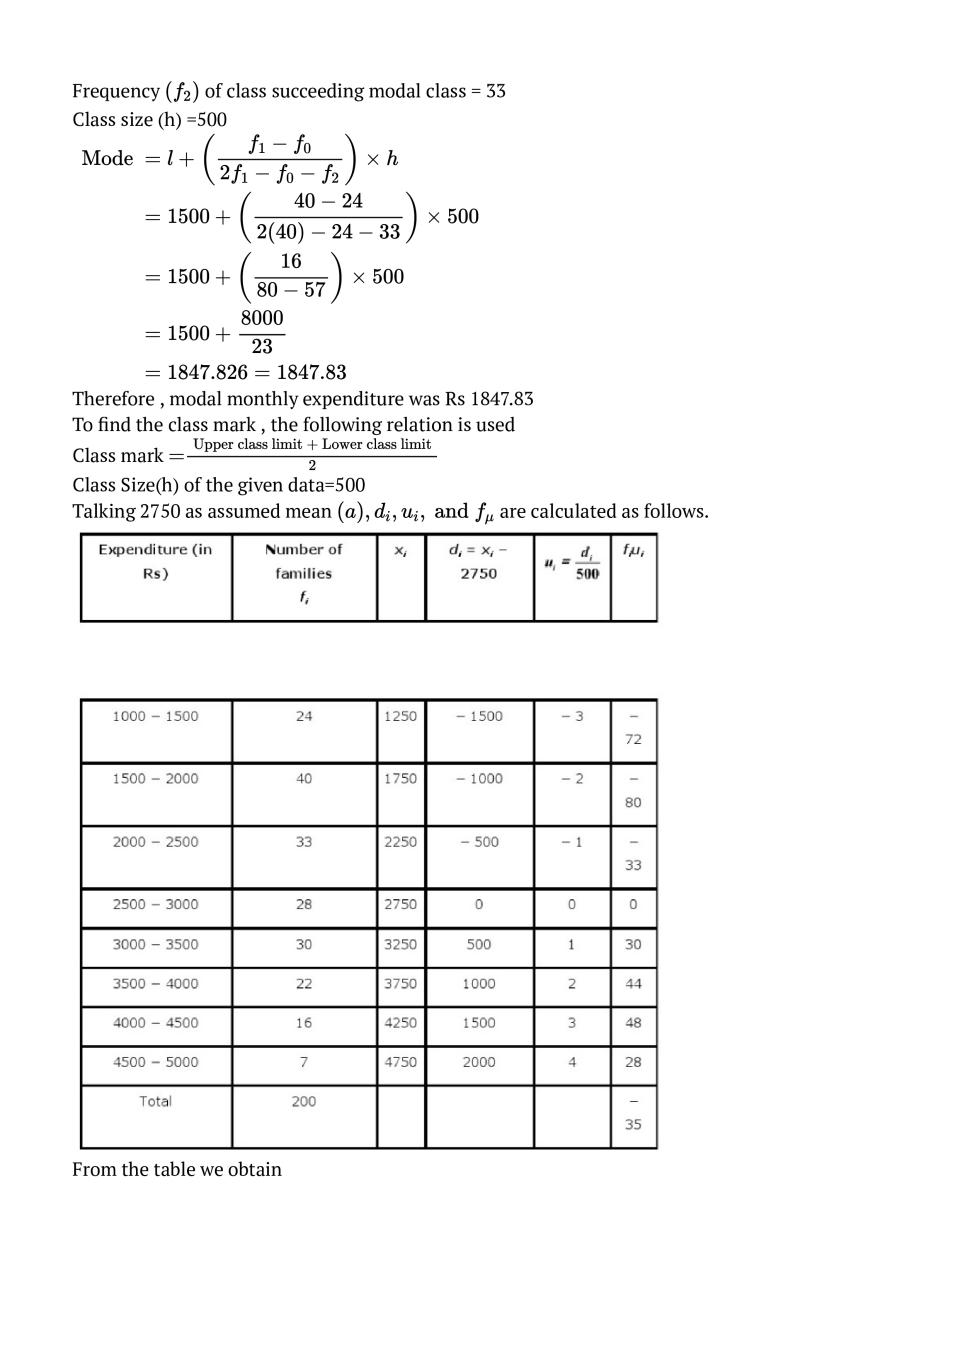
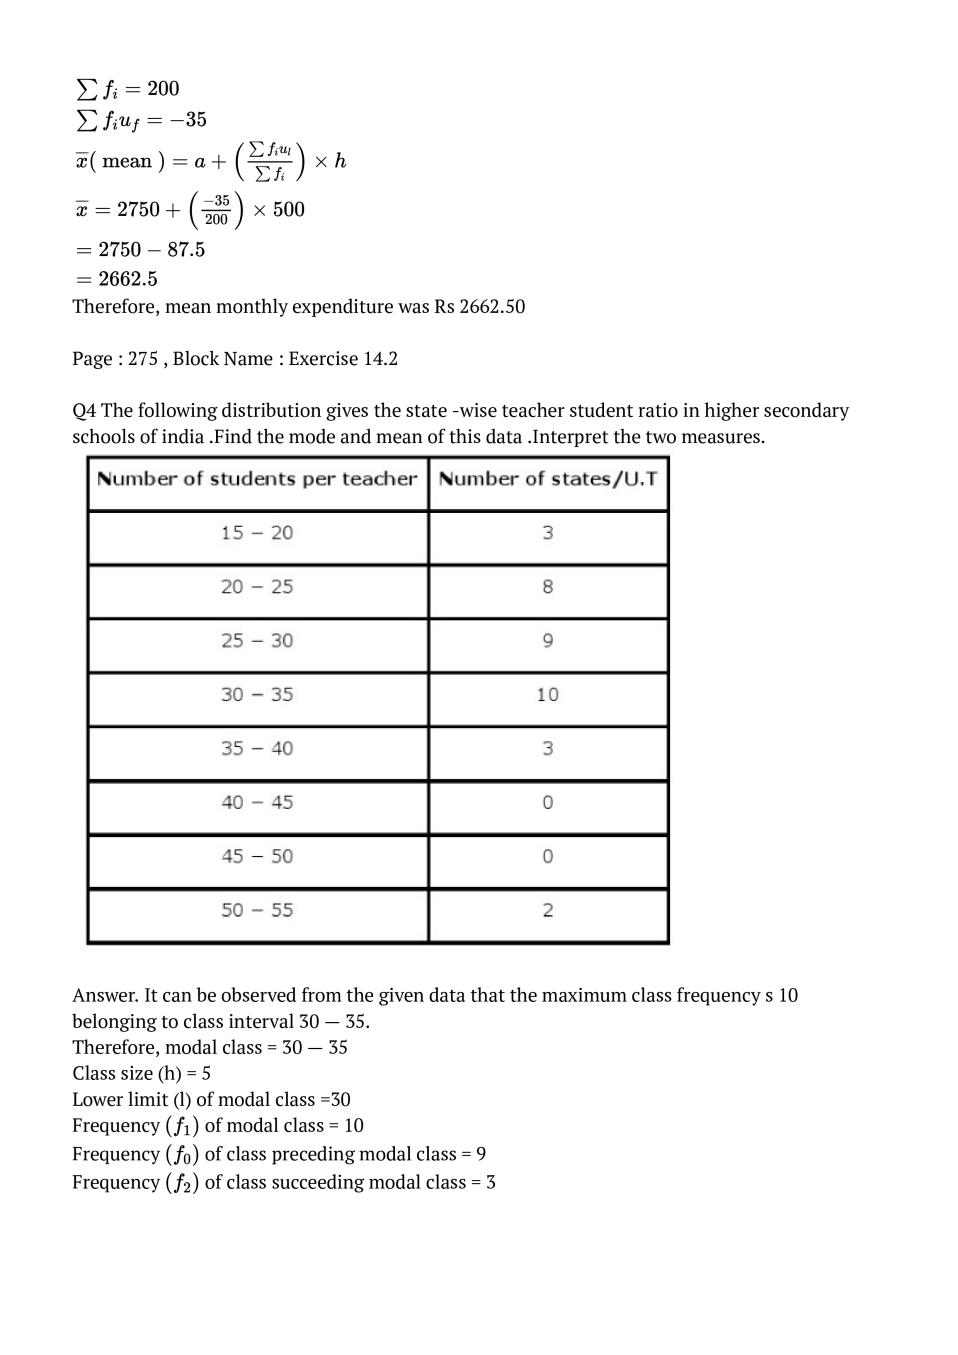
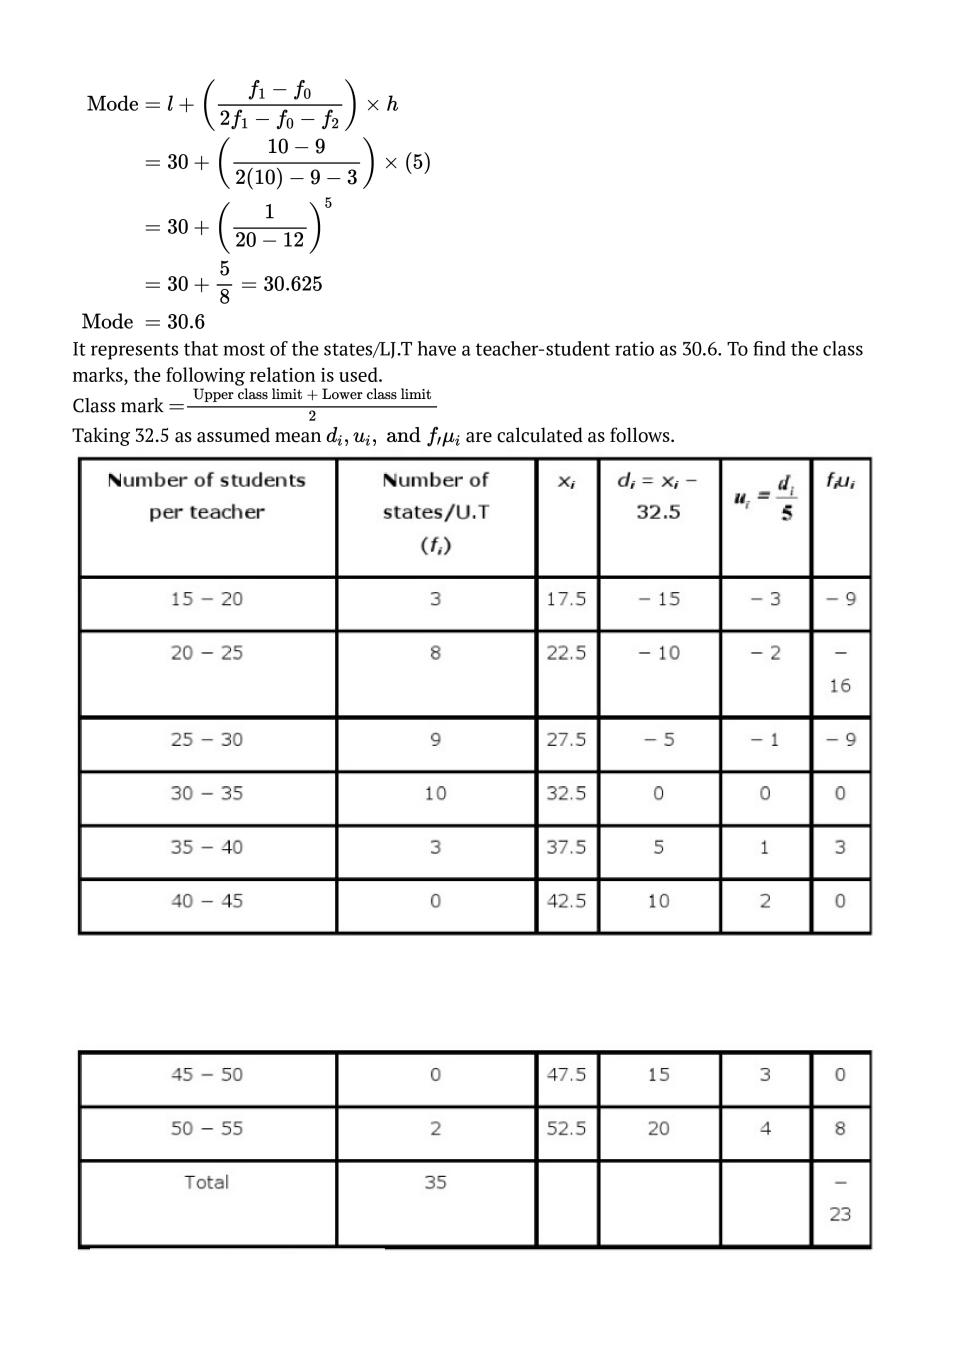
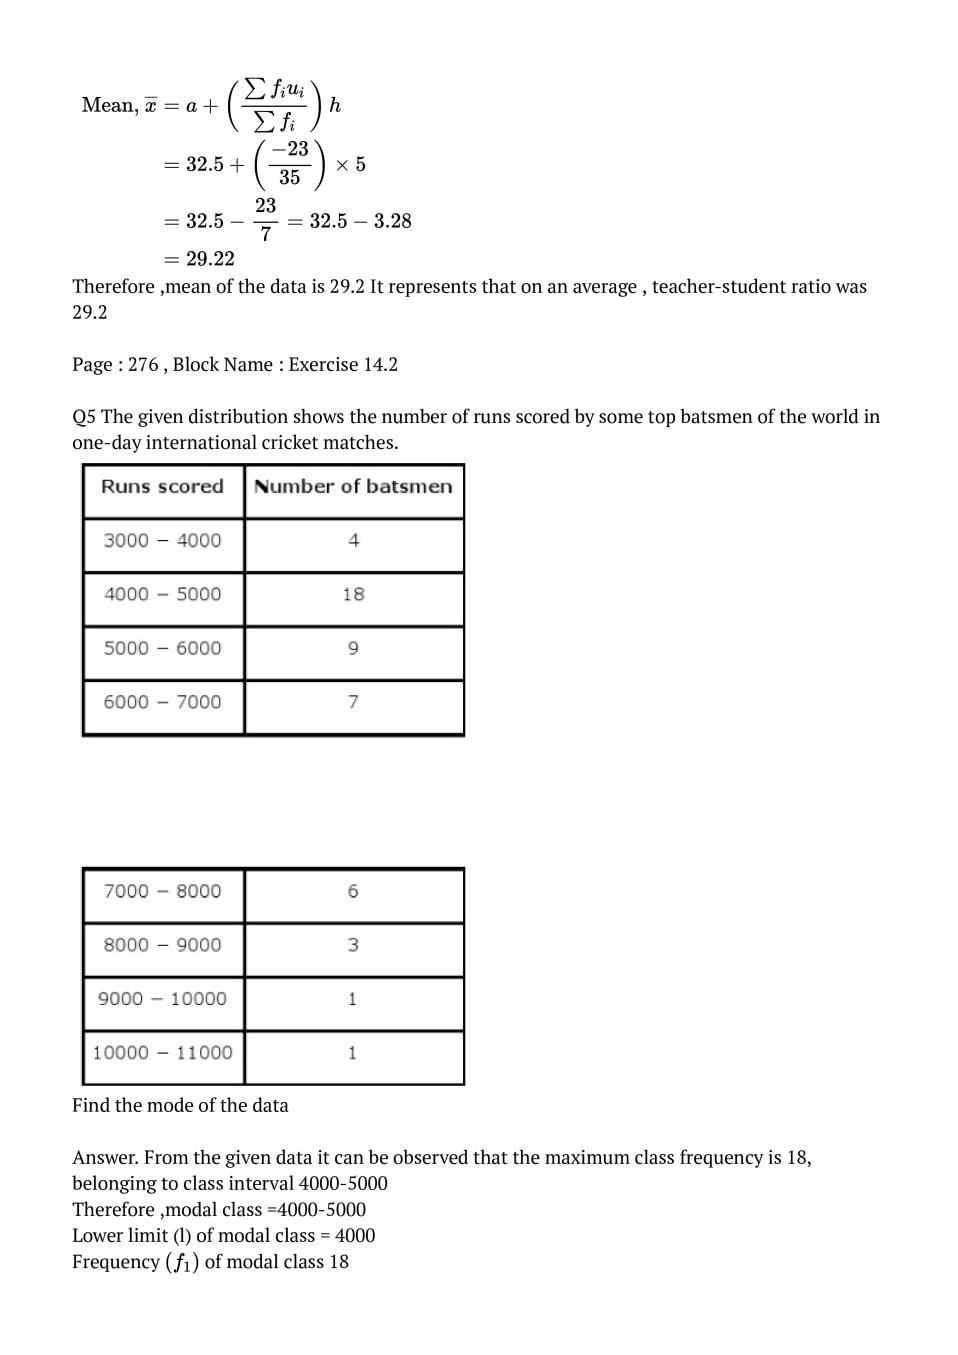
Q.5: In a retail market, fruit vendors were selling mangoes kept in packing boxes. These boxes contained varying number of mangoes. The following was the distribution of mangoes according to the number of boxes.
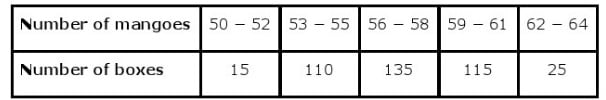 Find the mean number of mangoes kept in a packing box. Which method of finding the mean did you choose?
Ans :It can be observed that class intervals are not continuous. There is a gap of 1 between two class intervals. Therefore, 1/2 has to be added to the upper class limit and 1/2 has to be subtracted from the lower class limit of each interval. Class mark (x,) can be obtained by using the following elation. \( x_{i}=\frac{\text { Upper class limit + Lower class limit }}{2} \) Class size (h) of this data = 3 Taking 57 as assumed mean , \((a), d_{i}, u_{i t} f_{\mu_{i}} \) are calculated as follows.
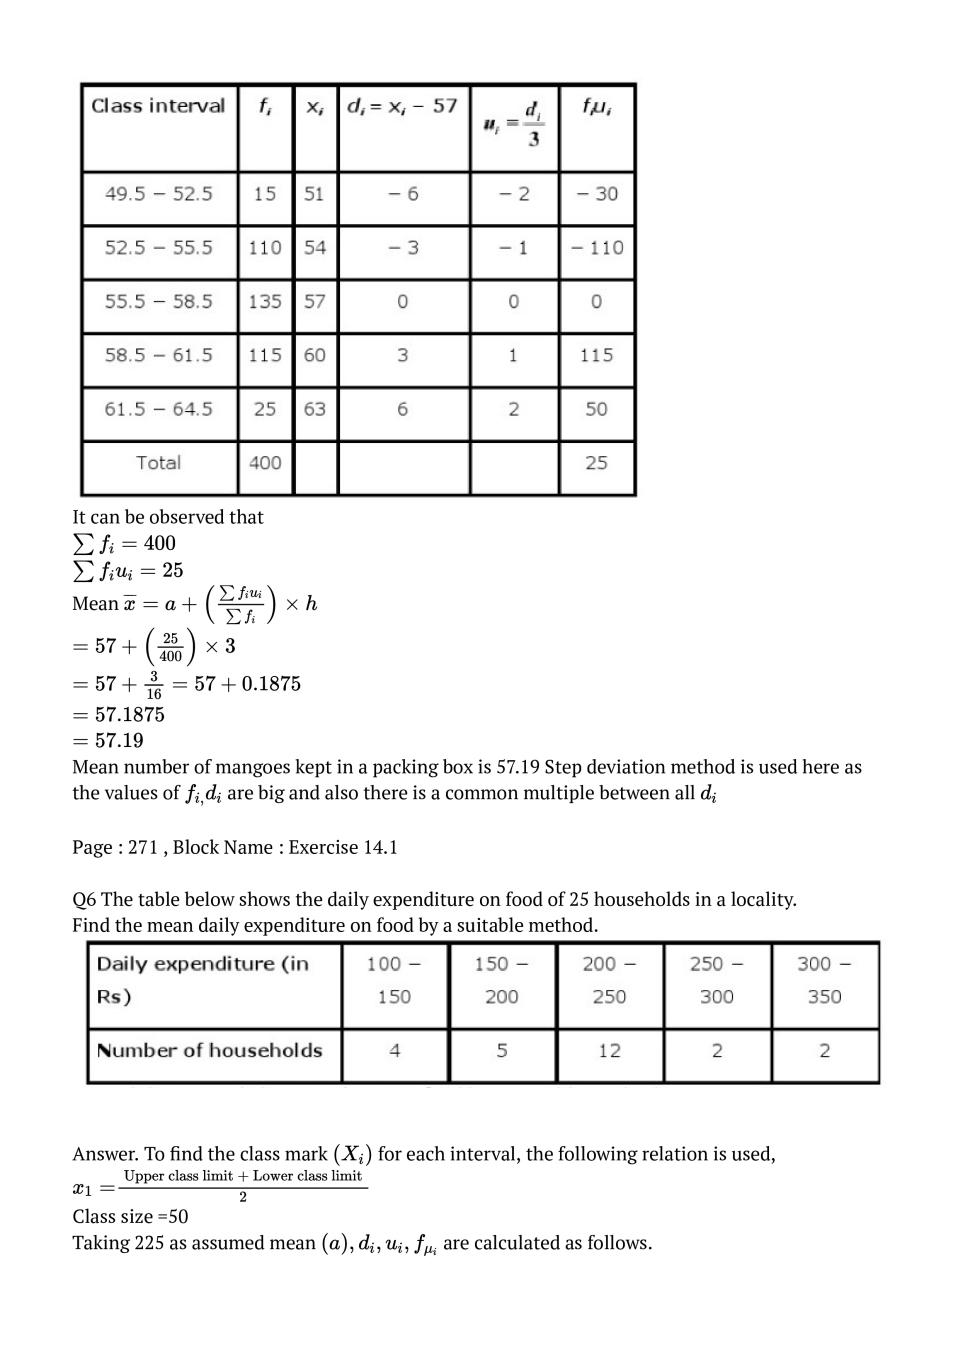
It can be observed that \( \sum f_{i}=400 \) \(\sum f_{i} u_{i}=25 \) Mean \( \overline{x}=a+\left(\frac{\sum f_{i} u_{i}}{\sum f_{i}}\right) \times h \) \(=57+\left(\frac{25}{400}\right) \times 3 \) \( =57+\frac{3}{16}=57+0.1875 \) \( =57.1875 \) \( =57.19 \) Mean number of mangoes kept in a packing box is 57.19 Step deviation method is used here as the values of \( f_{i,} d_{i} \) are big and also there is a common multiple between all \( d_{i} \)
NCERT / CBSE Book for Class 10 Maths
You can download the NCERT Book for Class 10 Maths in PDF format for free. Otherwise you can also buy it easily online.
- Click here for NCERT Book for Class 10 Maths
- Click here to buy NCERT Book for Class 10 Maths
All NCERT Solutions Class 10
- NCERT Solutions for Class 10 English
- NCERT Solutions for Class 10 Hindi
- NCERT Solutions for Class 10 Maths
- NCERT Solutions for Class 10 Science
- NCERT Solutions for Class 10 Social Science
- NCERT Solutions for Class 10 Sanskrit
All NCERT Solutions
You can also check out NCERT Solutions of other classes here. Click on the class number below to go to relevant NCERT Solutions of Class 1, 2, 3, 4, 5, 6, 7, 8, 9, 10, 11, 12.
| Class 4 | Class 5 | Class 6 |
| Class 7 | Class 8 | Class 9 |
| Class 10 | Class 11 | Class 12 |
Download the NCERT Solutions app for quick access to NCERT Solutions Class 10 Maths Chapter 14 Statistics. It will help you stay updated with relevant study material to help you top your class!
The post NCERT Solutions for Class 10 Maths Chapter 14 Statistics appeared first on AglaSem Schools.
from AglaSem Schools https://ift.tt/3xxULg1
https://ift.tt/3sZ7jtf https://ift.tt/3sZ7jtf
Post a Comment